

portfolio-theory

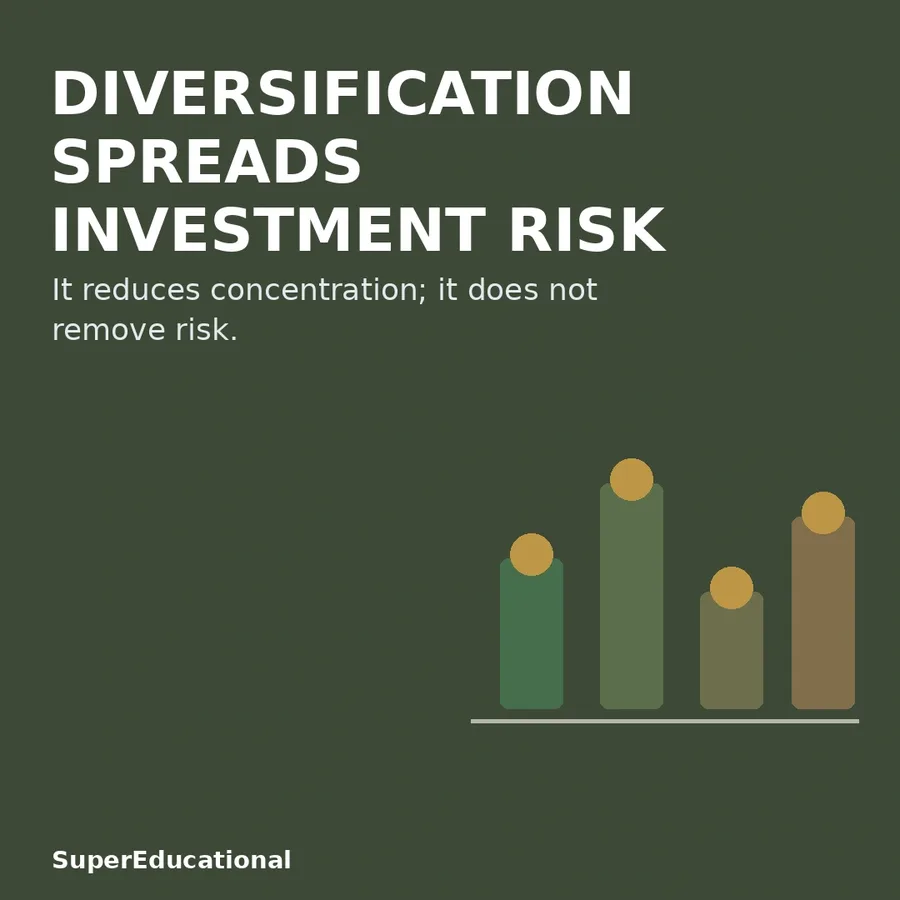
Your correlation matrix is lying to you. Here's the fix — and it comes from insurance math. In the first article, I built a stock market crash simulator using insurance catastrophe modeling. One layer of that tool changed my thinking more than any other: the vine copula. It's the mathematical answer to a question every investor has felt but few can articulate: Why does my "diversified" portfolio …

I've often seen 2-3 different ways factor models are constructed, but I don't understand when do you use one approach, the benefits. I do have some intuition but really looking for some industry context here Long-Short portfolio based on some ranking : Eg. Take P/B ratio sort all stocks and then create a ranking, go long the top quantile and short the bottom. You've a value factor portfolio. Do s…

Average strategy performance is one of the most common shortcuts in portfolio research. It gives the researcher a clean benchmark, a single reference line, and a simple way to compare one strategy against a broader group of similar strategies. In many cases, this is useful. But it can also be misleading. The problem is that an average hides dispersion. Two peer groups can have the same average r…

Time-series momentum stands as one of the most reliable and heavily backtested anomalies in quantitative finance, serving as a foundational alpha source for modern managed futures and trend-following strategies. However, a recent academic paper by Matti Suominen and Erik Hjalmarsson, titled "Boundaries of Time Series Momentum," uncovers a structural vulnerability that every practitioner must acco…

Part of a series on building Balance , a portfolio rebalancing app, as a solo developer. Balance started as a Brazilian-only app: B3 tickers, prices in reais, Brazilian income tax. Then came US stocks. Then crypto. The naïve path would have been three apps glued together — three price fetchers, three sets of forms, three rebalancing engines. Instead, the whole thing pivots on a single field: clas…

The Sharpe Ratio1, one of the most commonly used measure of risk-adjusted performance2, is usually reported as a point estimate (Morningstar, Quantalys, etc.). Thanks to the work of Lo3, Opdyke4 and more recently5 de Prado et al.6, it is nevertheless well understood that such a point estimate […] does not convey information about statistical significance6, so that a more meaningful way to measure…

SEBI Research Department released earlier studies on profits and losses (mostly losses) of retail traders in derivatives markets in 2023 and 2024. Both showed 90 percent of traders made losses leading to lots of discussions. SEBI took some measures to slowen trading activity in derivatives. The 2026 study shows though losses have declined but investors […]

SEBI research team has released a study on trading behaviour of derivatives traders: 1. The study indicates that equity derivatives trading by individual investors is characterized by high trading intensity,particularly in short- duration options contracts, with a large proportion of trading concentrated in contracts nearing expiry. 2. Trading activity is predominantly concentrated among relative…

I am reading Harry Markowitz’s “ Portfolio Selection ” ( Journal of Finance , 1952), and I cannot determine whether Figure 4 contains a labeling error or whether I am misunderstanding the paper. On PDF page 11 (journal page 86), Figure 4 shows a three-dimensional coordinate system with axes $X_1$ , $X_2$ , and $X_3$ , together with three lines labeled $l_{1234}$ , $l_{234}$ , and $l_{124}$ . On t…

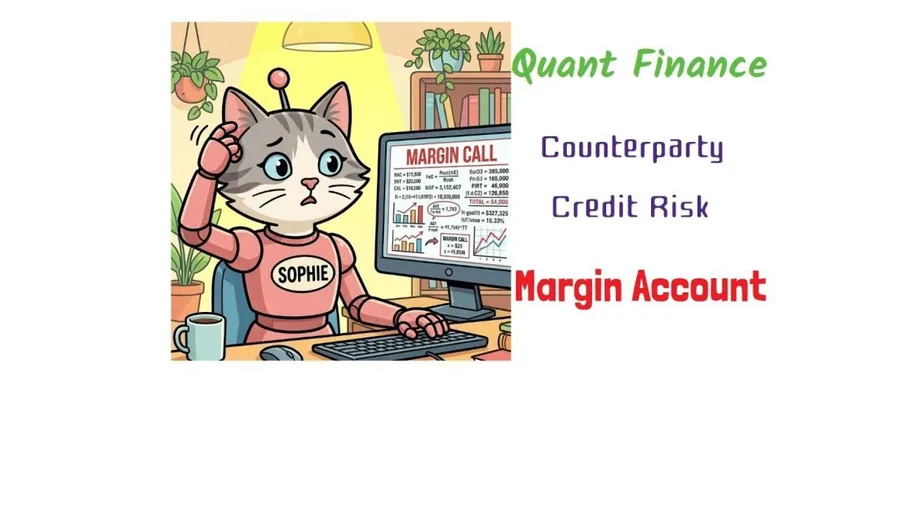
Inside Prime Brokerage credit risk: Regulation T vs Portfolio Margin, Worst Case Loss stress grids, House Excess limits, and forced liquidation mechanics. 📊 Deep Research 🎥 Watch Video: https://youtu.be/6zu_PtYmYrY Topics: quantitative finance, investment analysis, financial education, financial research, market analysis

I have been looking to understand the H-model in finance, that is used for stock price valuation. In particular, I wanted to formally derive the final formula: $$PV=\frac{D}{r-g_2}\left[1+g_2+\frac{H}{2}(g_1-g_2)\right]$$ Here $PV>0$ is the present value (price) of the stock, $D>0$ is the constant dividend payment that is paid forever, $r\in(0;1)$ is the required rate of return on the stock and t…

We document a persistent intramonth momentum cycle in U.S. sector ETFs that yields meaningful risk-adjusted returns when properly sequenced. Using the nine original Select Sector SPDR ETFs and SPY as the market benchmark from December 1998 through June 2026, we show that trailing 252-day sector momentum generates a positive spread on the first trading day of the month—and then sharply reverses on…

I am building an event-driven capital allocator for three trading strategies. This is a portfolio-optimization and validation question, not a request for investment advice. This question follows an earlier question about pricing capital reserved for stochastic future signals . A new experiment appears to have resolved that particular issue, but it has isolated a different one: estimating the appr…

research.ioresearch.io

Sign up to keep scrolling

Create your feed subscriptions, save articles, keep scrolling.

Already have an account?